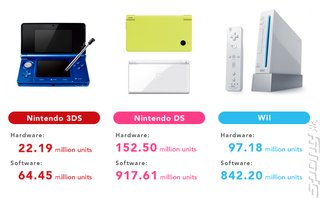
You've got to hand it to Nintendo - they know how to present sales data. Alongside a humbled profits forecast for the current fiscal year, the company has published an exhaustive list of lifetime sales for every single major hardware release.
Along with a colourful chart on its investor website detailing worldwide lifetime sales to date for all Nintendo platforms, the Japanese giant also has a PDF file that tracks annual Q3 sales for all hardware and software dating back to 1998, broken down by region.
It makes for some absolutely fascinating reading - from the NES and SNES' relatively disastrous sales outside of the Americas and Japan (which includes Europe), to the Americas' warmer reception to the Nintendo 64 and Gamecube, to the explosive sales of the Nintendo DS.
We've compiled a list of lifetime-to-date sales for hardware by region, below. Check out the full PDF for the annual Q3 splits, software sales and further breakdowns that detail how many specific revisions of Nintendo hardware (DS Lite, 3DS XL) were sold.
Game Boy:
Japan: 32,470,000
Americas: 44,060,000
Other: 42,160,000
Worldwide: 118,690,000
Game Boy Advance:
Japan: 16,960,000
Americas: 41,640,000
Other: 22,910,000
Worldwide: 81,510,000
Nintendo DS:
Japan: 32,990,000
Americas: 58,540,000
Other: 60,970,000
Worldwide: 152,500,000
Nintendo 3DS:
Japan: 7,940,000
Americas: 7,380,000
Other: 6,880,000
Worldwide: 22,190,000
------
NES:
Japan: 19,350,000
Americas: 34,000,000
Other: 8,560,000
Worldwide: 61,910,000
SNES:
Japan: 17,170,000
Americas: 23,350,000
Other: 8,580,000
Worldwide: 49,100,000
Nintendo 64:
Japan: 5,540,000
Americas: 20,630,000
Other: 6,750,000
Worldwide: 32,930,000
Gamecube:
Japan: 4,040,000
Americas: 12,940,000
Other: 4,770,000
Worldwide: 21,740,000
Wii:
Japan: 12,640,000
Americas: 46,120,000
Other: 38,420,000
Worldwide: 97,180,000
Companies:
Nintendo
Read More Like This
